Remote Access Trojan
VenomRAT - ClientAny.exe
- Author
- Moise Medici
- Updated
- 15 Nov 2025 · Completed
- Difficulty
- Easy
- Platform
- Capabilities
- Tags
Standard User execution
There are no new tasks in the task scheduler, probably due to the lack of permissions.
After the execution, in Procmon, the process tree view looks like this:

Inspecting each of the subprocesses that have been invoked by the sample shows that:
cmd.exeis executed with\WINDOWS\system32\cmd.exe /c ""C:\Users\REM\AppData\Local\Temp\tmp8A48.tmp.bat"". What is its content?timeoutis executed with3.- the spawn of the new process called
dadada.execomes from"C:\Users\REM\AppData\Roaming\dadada.exe". Is it a clone of the current sample?
C:\Users\REM\AppData\Local\Temp\tmp8A48.tmp.bat can be found, but it is empty.
The SHA256 of "C:\Users\REM\AppData\Roaming\dadada.exe" is 8f5bb49ef2c1178c113d477f70856b3d59a107a6f5a551199fb5ea0be911c496, so it is just a copy.
With the process tree identified, it is useful to see what has been executed. From the list of operations that the sample might be performing, checking the registries is the easiest task, so the analysis starts from there.
In the Process Tree view, selecting the sample process and choosing “Include Subtree” filters for all the PIDs of the sample and the spawned processes. Then, under Tools > Registry Summary… it is possible to see all the registries that have been accessed by the processes. Sorting the table by the number of Writes and looking at the Path, one value looks interesting: HKCU\Software\Microsoft\Windows\CurrentVersion\Run\dadada
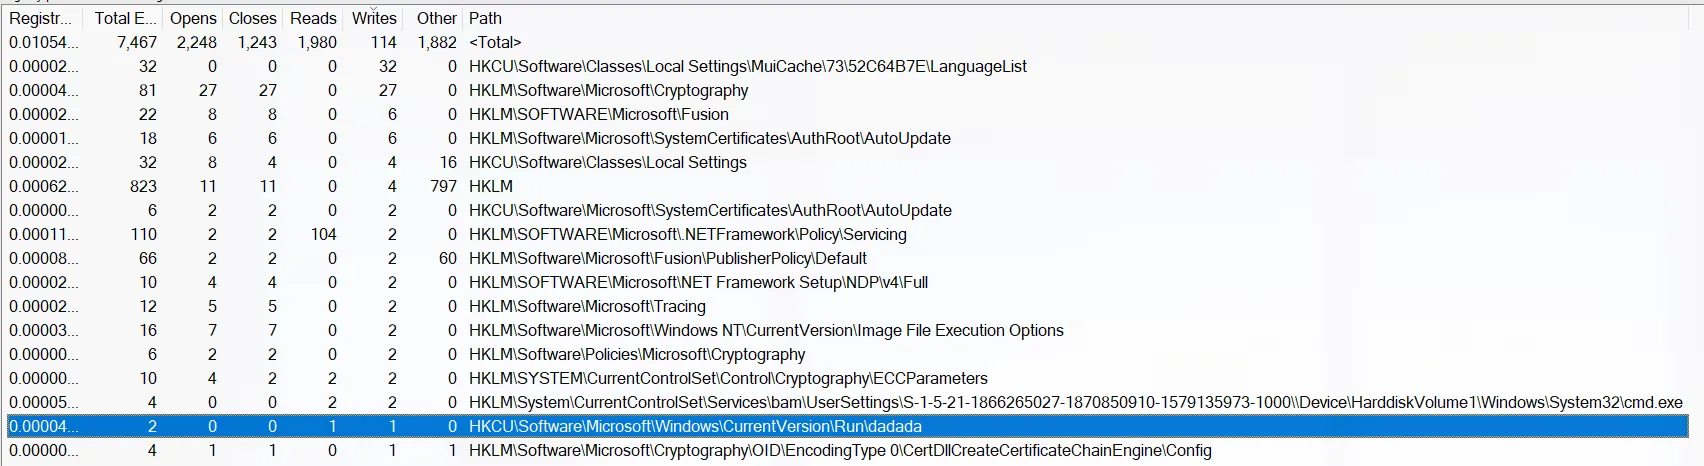
This is a common path in malware since it defines applications to execute at startup. By double-clicking on the entry and going back to the Procmon main view, the content of what was written can be inspected by clicking on one of the two entries and selecting Properties. The value written is "C:\Users\REM\AppData\Roaming\dadada.exe".

The other entries are of less interest at the moment, since they are commonly used by any executable. The .NET and Cryptography registry hives can be related to any kind of operation.
In a similar way, the files that have been accessed can be reviewed using the Tools > Files Summary… menu. In the “By Folder” tab a few entries are worth looking at.
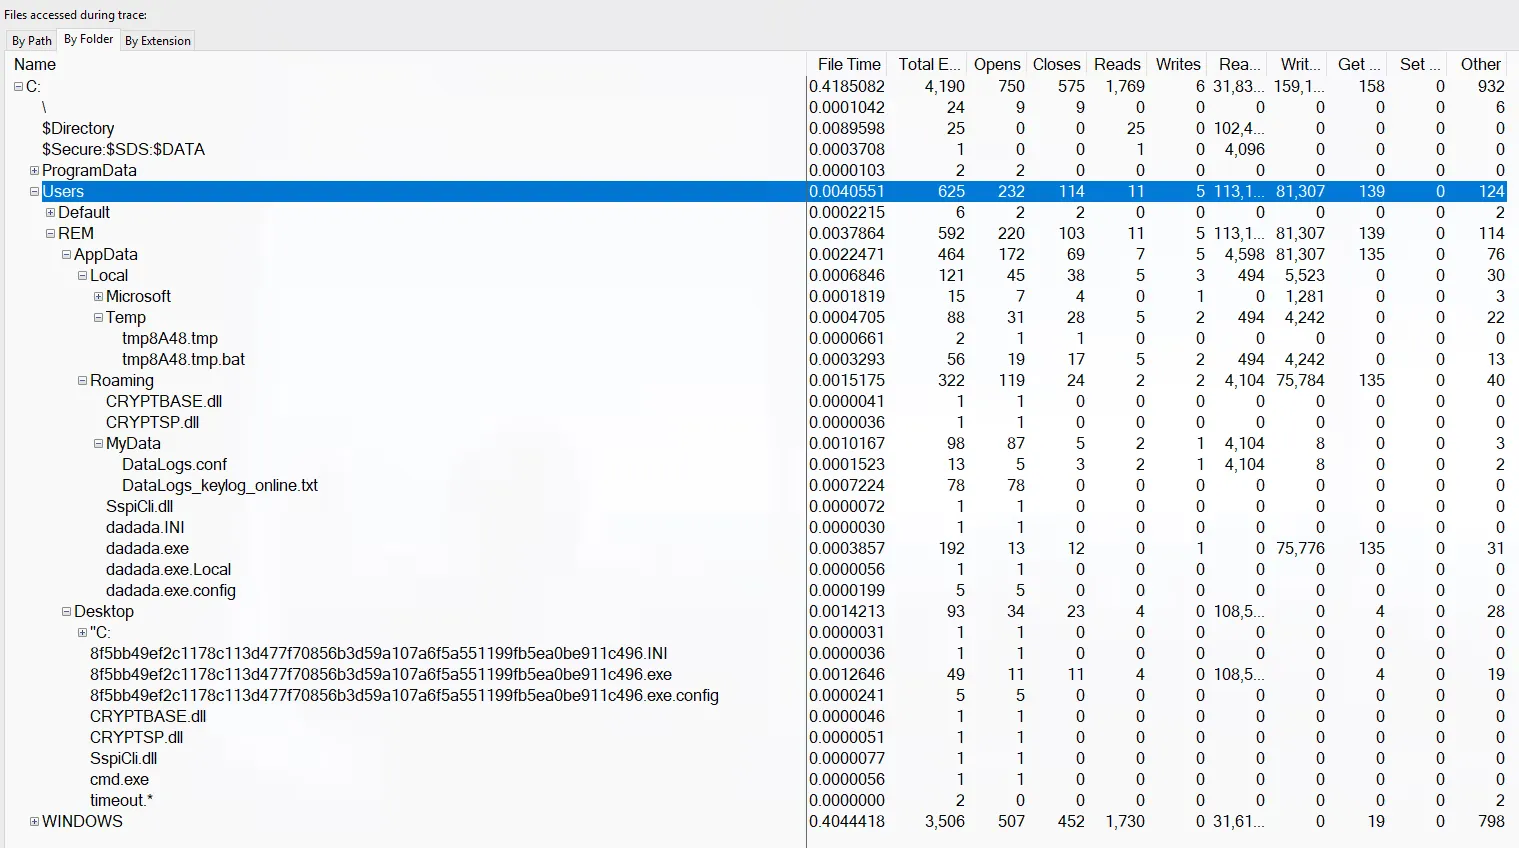
Specifically, entries under AppData. Starting from C:\Users\REM\AppData\Roaming\MyData\DataLogs.conf, a quick way to get there from Procmon is to double click on the entry in the Files Summary window, so that Procmon filters for those specific events, then from the Procmon main window, right click on the path and click “Jump To…”.
The content of the .conf file is:
5Falsewhich is not exactly clear so far.
The rest of the files are not currently found; it may be necessary to see whether, when running as admin, they will become available.
On the network side, looking at Wireshark, the only traffic observed is a call to paste.ee, a pastebin website, via HTTPS. This might mean that the actual configuration is coming from a paste service. This is something that can be understood more clearly from the code.